TLDR: I wrote a simulation of an experiment that bounced a radio signal off the Moon and produced a cool delay-Doppler plot. My simulation matches the plot pretty closely! Using my program I estimate that when the full results are release on January 27 or 28, 2022 (tomorrow at the day of writing!) the exact time of transmission will be October 5, 2021 12:24 UTC. Here are the two plots:
|
|
|
 |
 |
All the Julia code to make my image is available on Github here.
There's also a bit here about estimate the size of location of the Moon from this Doppler-delay plot!
A couple months ago, I saw a post on Hackaday about an experiment that bounced a LoRa radio signal off the Moon and received it back on Earth. What makes this experiment so neat is that the group behind it made use of the LoRa modulation scheme, which is normally used for Internet-of-Things communication on the ground. LoRa was chosen here because it works well even at very low signal-to-noise levels, so with the help of the big Dwingeloo Radio Telescope the experimenters could pick up and decode a relatively low-power signal bounced off the Moon.
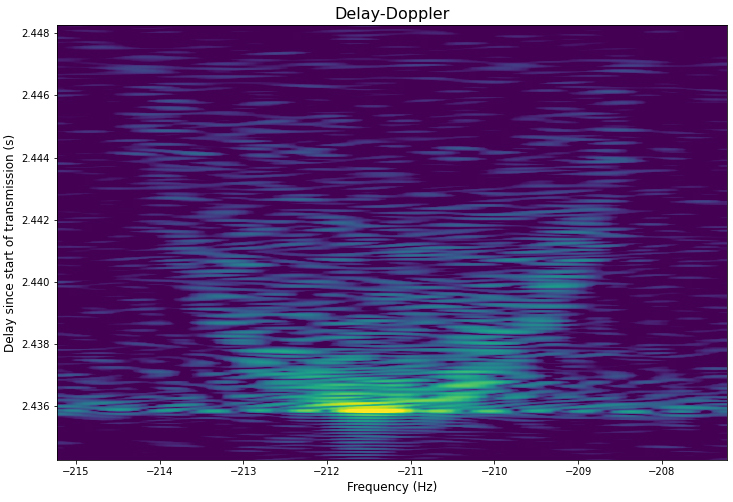
More details from the team can be found the the Lacuna Space website, along with this great image of the time delay and Dopper shift of the received signal after bouncing off the Moon:
This is super cool! You can kind of see the shape of the Moon (a sphere). I wanted to write a simulation of this kind of experiment to see if there are other details you could pull of from a RADAR image of the Moon like this. As an added challenge, the full results of the experiment are slated to be released at a conference on January 27-28, 2022, so if I could write a simulator before that I might be able to extract some info from that picture before the experimenters even present!
Scheme
A detailed description of how I made my charts here can be found in the source code. I may update this page later with additional description of what's going on in the code, but the gist of it is:
- Choose a transmitter location and time (I'm using October 5, 2021 at Dwingeloo)
- Generate a bunch of points on the Moon's surface. These will represente scatterers or reflectors on the
Moon that will reflect the transmitted signal back to Earth
- I finally had an excuse to use the Fibonacci sphere covering technique described by extremelearning.com.au
- Calculate the time between transmission from the and incidence on the Moon at each reflector point, then
also calculate the time for a reflection from each point to return to the receiver on Earth
- This is the bulk of the work of the program. It's made non-trivial because both the Earth and Moon are
in motion. See the
moonbouncefunction for implementation
- This is the bulk of the work of the program. It's made non-trivial because both the Earth and Moon are
in motion. See the
- Take those signal delays to work out the positions and velocities of the transmitter and lunar reflector at transmit time, reflection time, and reception time
- Use positions and velocities to work out Doppler shift
- Plot!
Logs
I wrote down some notes and observations while developing this simulation program and I've copied some of the interesting ones below.
These are just a few select tagged commits - full code is available here.
v0.5.0 - A Nice Plot
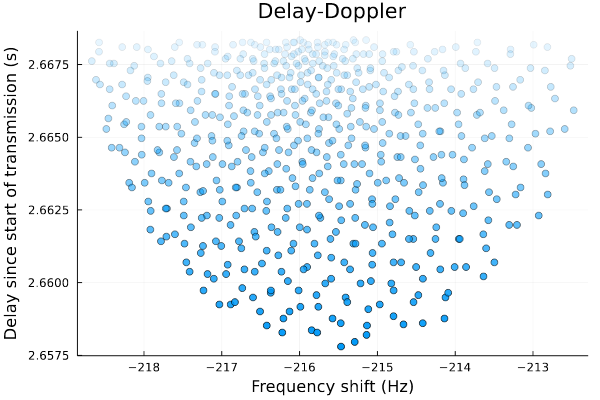
Looks pretty good! Each dot here is the delay and Doppler shift of a signal bounced of a particular reflector on the Moon's surface.
The main differences I'm noticing are:
- Delay time. The experiment shows delays of ~2.4 s, while mine shows delays of ~2.6 s. That's a pretty big
difference. For comparison, Earth 0.042 lightseconds in diameter and the Moon is 0.012 lightseconds in
diameter, and the delay difference between the two plots (~0.2 s) is an order of magnitude higher than those.
- I'm ignoring any relativistic effects here, but I think the gravitational potentials and speeds are both small enough to not be significant here.
- Density of points. The experiment's chart seems to show an outline of the Moon, while mine seems to show more of a filled-in area. I suspect this difference could be due to my reflection model or to differences in plotting colors. The experiment is probably plotting signal strength in dB, which might impact how image comes out.
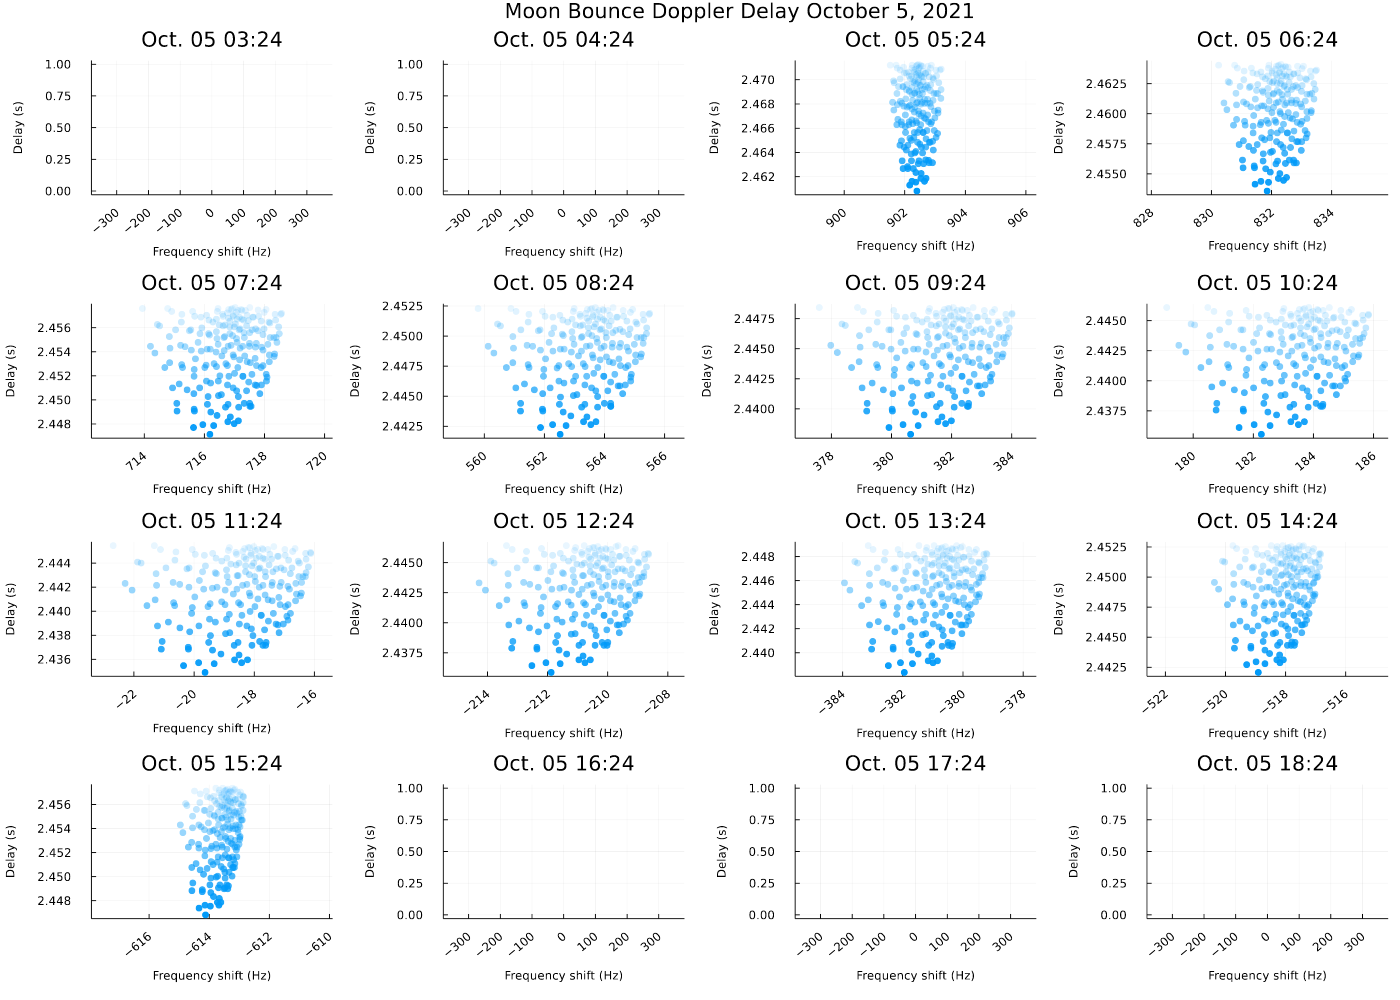
v.0.6.0 - A Nice Panel Plot
Here are a bunch of Moon bounces an hour apart. The delay is still not quite right, but it's cool to see how the Doppler-delay picture changes as the Earth rotates. The experiment must have been conducted at a particular time to get the nice symmetric RADAR image shown at the top.
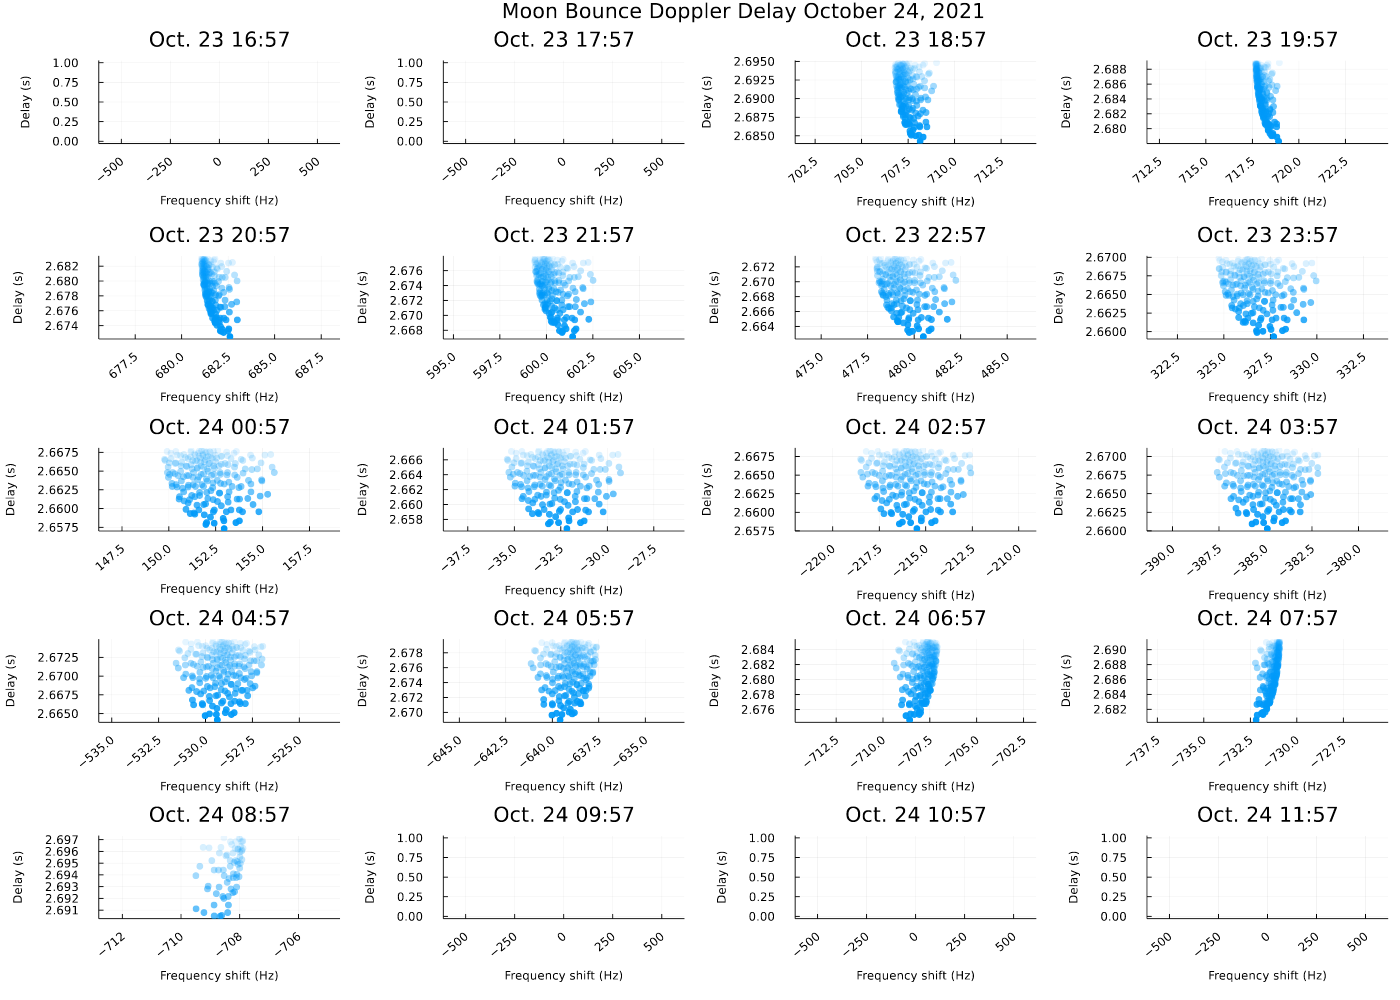
The blank charts are ones where the Moon is below the horizon of the transmitter on Earth.
One question I have here is: why can I get 15 Moon bounces over 15 hours? Shouldn't moonrise and moonset be about 12 hours apart?
v0.8.0 - Correct Date!
I totally had the wrong date in the past versions! The Lacuna Space post says image I'm trying to recreate was produced from a signal transmitted on October 5, 2021, but for some reason I was plotting transmissions around October 24, 2021. No idea why! But here's the plot on the correct day:
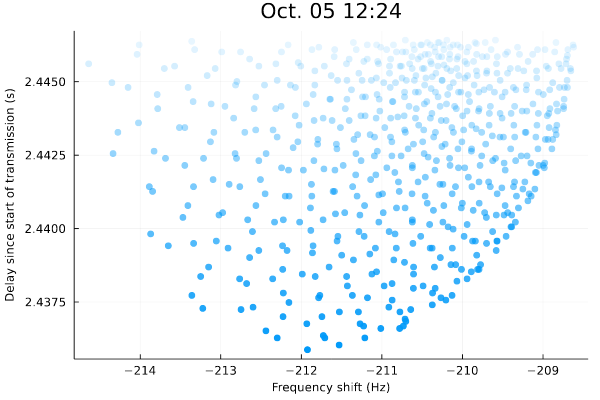
And here's a big one on a time I chose to match the frequency shift seen in the experiment's chart:
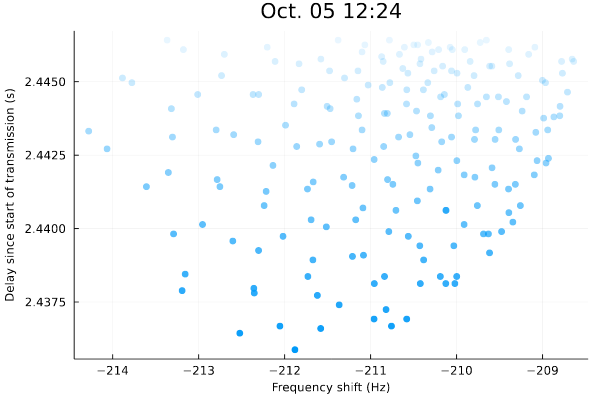
Check that out - the delays match! And really well!
What cool with this is that I (think I) have estimated the exact time the experiment was conducted: not just October 5, 2021 as stated in the experiment's brief, but October 5, 2021 12:24 UTC. I'm excited to read the paper or watch the presentation (which should be available on January 27-28, 2022) and see if I'm right!
Here's another version with more reflectors on the Moon's surface. You can see the disk filling in better:
Using the Image
I think the image produced by the experiments is very cool looking, but can we do anything with it?
Estimating the Distance to the Moon
We can easily estimate the distance to the Moon from these two charts by looking at the delay. The distance to the Moon should be the return delay times the speed of light, divided by 2 (to account for the out-and-back path of the signal). Lacuna's plot shows that the first reflected signal was received with a delay of about 2.436 seconds:
julia> c = 299792458 # m/s
299792458

julia> echoTime = 2.436 # seconds
2.436

julia> lunarDistance = c * echoTime / 2
3.65147213844e8

julia> ans/1000 # in kilometers
365147.21384399995

julia> ans + 6371 + 1738.1 # add in Earth radius and Moon radius to get center-to-center distance in km
373256
julia> c = 299792458 # m/s
299792458

julia> echoTime = 2.436 # seconds
2.436

julia> lunarDistance = c * echoTime / 2
3.65147213844e8

julia> ans/1000 # in kilometers
365147.21384399995

julia> ans + 6371 + 1738.1 # add in Earth radius and Moon radius to get center-to-center distance in km
373256
So the Earth-Moon center-to-center is about 373,256 km. Wikipedia gives the accepted Lunar Distance as 384,399 km, so that's pretty close. That same page gives the difference between the lunar apogee and perigee as 50,200 km, so this quick time delay estimate is well with the correct range. Neat!
Estimating the Size of the Moon
But what if we don't know the radius of the Moon? We can estimate that by looking at the difference between the shortest and longest delays. It looks to me like the shortest and longest delays in the Lacuna plot are 2.436 seconds and 2.4475 seconds, respectively. The radius should be the difference between those two times the speed of light, again divided by 2:
julia> c = 299792458 # m/s
299792458

julia> short = 2.436 # seconds
2.436

julia> long = 2.4475 # seconds
2.4475

julia> c * (long - short) / 2
1.7238066334999765e6

julia> ans/1000 # convert to km
1723.8066334999764
julia> c = 299792458 # m/s
299792458

julia> short = 2.436 # seconds
2.436

julia> long = 2.4475 # seconds
2.4475

julia> c * (long - short) / 2
1.7238066334999765e6

julia> ans/1000 # convert to km
1723.8066334999764
Which is pretty close to the accepted radius 1738.1 km. Only 15 km off from a fuzzy RADAR image made by a reflected (and ampified) IoT signal. Pretty cool!
There are probably more things about the Moon we could glean from this really cool image (we didn't even touch the Doppler stuff!), but that's all I've got for now. Thanks for reading!